Example 1: Planning a project
The following scenario is typical in all sorts of projects, regardless of whether it's
- a software project,
- preparation for an exhibition or a trade-fair,
- writing a report, or
- before a wedding.
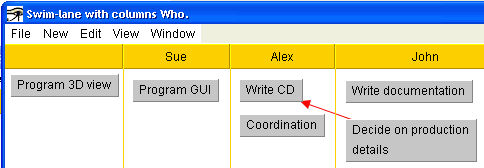
You start a project and input a few activities:

You input the members of the team, and immediately you can decide who does what:
You might need a time-axis. Here we use weeks:
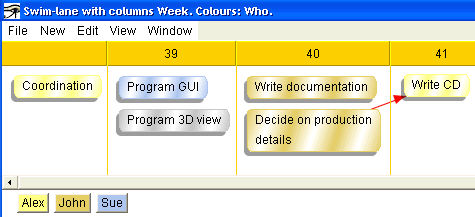
The colour of an element can be used to tell you who should carry out that activity. (We can already see that John is going to be working alone in week 40 - should the others book their holiday, or could we reorganize a little?)
We can plan more exactly, which could lead to the following view. A filter is used (note the title bar) so that only one person's data is shown:
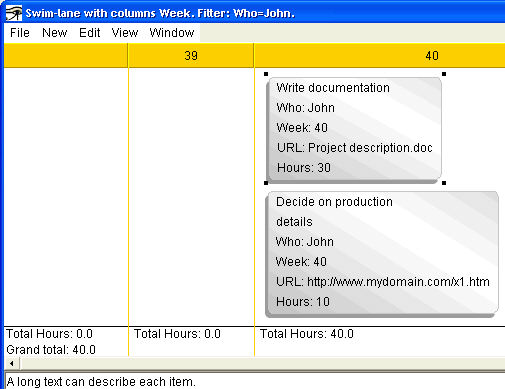
In the view above, you can see
- "opened" elements showing all their details,
- an automatic addition function, and
- the ability to store URLs (file names or addresses in the web) in an element. 2 clicks on the element open that document. So i2Brain can collect and govern references to all sorts of data.
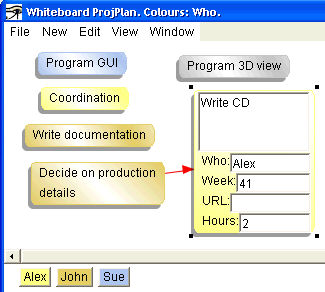
Details of the elements can be changed by dragging and dropping the box to a different column in a column-view, or by editing the details as text in standard input fields.
As soon you have input the data, you can change your view of it as you like. In projects containing dozens or even hundreds of elements, you can get a better overview of what is going on, so you understand it better, and you can detect problems more easily.
NB: The "aspects" used here ("who", "week", "URL" and "hours") are only examples. You can choose your own freely. E.g. "priority", "which department should take care of an activity", "status" (planned, in progress, finished, tested) etc.
Similar projects are included with the demo version. Try it out now.
Unlock the limitations of the demo version by buying a licence.